14 Metabolomics and Pathway Analysis
Acknowledgements
NotebookLM was used to find and query reference materials cited in these notes. The main source used when preparing these notes is an article on pathway analysis for metabolomics by Wieder et al. (2021). The information below comes from that article unless otherwise noted.
Introduction to Metabolomics
Metabolites: Small molecules, which are distinct from larger biomolecules like proteins and nucleic acids
Metabolomics: Profiling of small molecules (metabolites) within a biological system
- Aim: Understand how cellular biochemistry correlates with biology
- Exposure to environmental conditions
- Differing genetic backgrounds
- Disease status
- Datasets tend to cover a much lower proportion of the total metabolome compared to typical transcriptomic coverage
Applications
Biomarker discovery
Personalized medicine
Agriculture (e.g. crop protection and food security)
Profiling Methods
- Mass Spectrometry (MS) and Nuclear Magnetic Resonance (NMR) are typical
- MS-based approaches typically detect a larger number of compounds compared to standard NMR methods
- Experimental platforms vary, including
- UPLC-MS/MS (Ultra-Performance Liquid Chromatography - Tandem Mass Spec)
- CE-TOF MS (Capilary Electrophoresis - Time-of-Flight Mass Spec)
- Flow injection TOF MS (which may use no chromatography/electrophoresis separation step)
Data acquisition and identification challenges
- Untargeted Metabolomics: Metabolites are annotated based on
- Physicochemical properties (e.g. mass-to-charge ratio (\(\text{m/z}\)) and polarity)
- Similarity to compounds in spectral databases
- Uncertainty in identification
- Significant bottleneck is the metabolite identification uncertainty
- Chemical structures
- Database identifiers
- Significant bottleneck is the metabolite identification uncertainty
- Metabolomics Standards Initiative (MSI) proposes minimum reporting standards for metabolite identification (Chen et al. 2020)
- Level 1: identified using an authentic chemical standard
- Level 2: putatively identified based on physicochemicsl properties in a spectral database
- Level 3: probable/uncertain annotation
- Level 4: unknown compound
- Assay bias
- Specific analytical platform and assay introduce chemical bias
- Each is better suited to detect compounds with specific physico-chemical properties (e.g. fatty acids, glycans, vitamins, etc…)
- Limited metabolic network areas are sampled by each assay type
Data preparation
- Raw metabolite abundance matrices typically need post-processing
- Imputation of missing values (e.g. using minimum value divided by 2)
- \(\log_2\) transformation
- Auto-scaling (subtracting mean and dividing by standard deviation)
Pathway Analysis (PA) Tools
- PA is essential for the interpretation of high-dimensional molecular data
- Pathways are collections of molecules participating in the same biological function
- Find associations between pathways and specific phenotypes
- PA was originally developed for transcriptomic data but has been adapted for metabolomics
Pathway analysis methods
-   Over-representation analysis (ORA)
    -   Most common PA approach
    -   Identifies pathways that contain a statistically higher number of certian molecules than would be expected by chance
-   Functional class scoring (FCS), e.g. Gene Set Enrichment Analysis (GSEA)
-   Topology-based methods, i.e. network/graph analysis
ORA Inputs
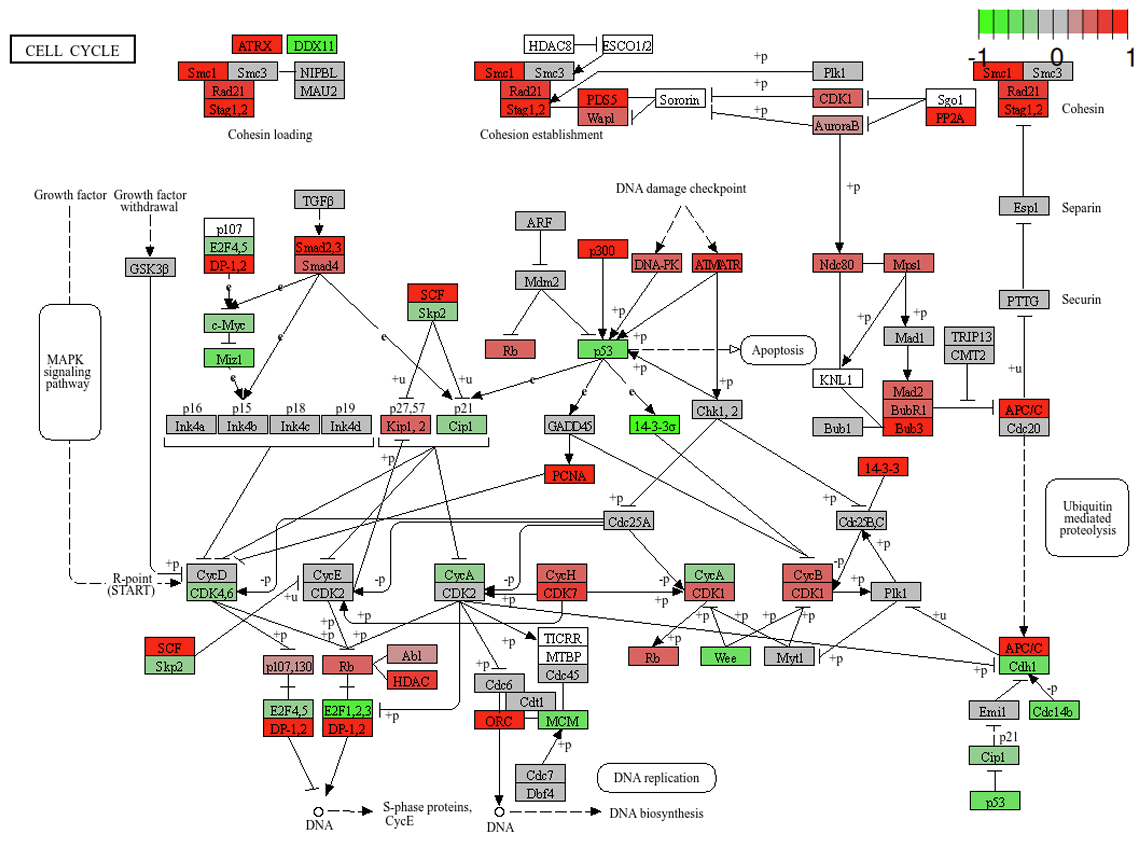
- Pathway collection obtained from databases like
- KEGG (Kyoto Encyclopedia of Genes and Genomes)
- Reactome and
- BioCyc, or
- Commercial tools like IPA
- Differentially abundant (DA) metabolites of interest
- List derived from experimental data, typically selected using a statistical threshold
- Background/reference set
- Contains all compounds realistically detectable by the experiment
- e.g. all identified compounds in the assay
Generating DA metabolite lists
Determined using statistical comparisons of metabolite abundances between study groups
Multiple testing correction must be applied to the resulting p-values
- Benjamini-Hochberg False Discovery Rate
- Bonferroni correction
Data Visualization Tools
Data Visualization Tools
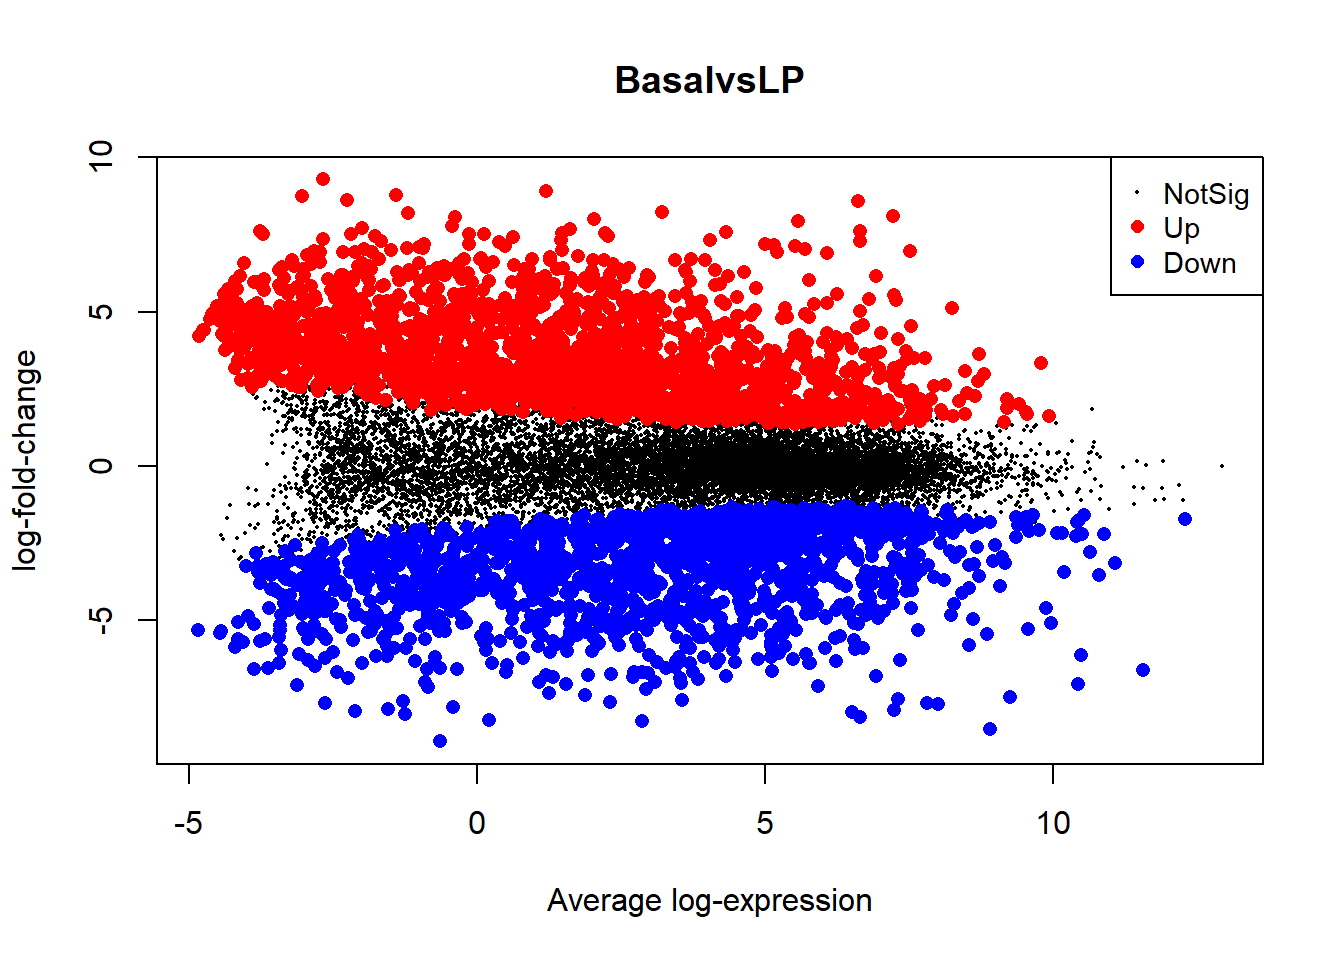
Data Visualization Tools
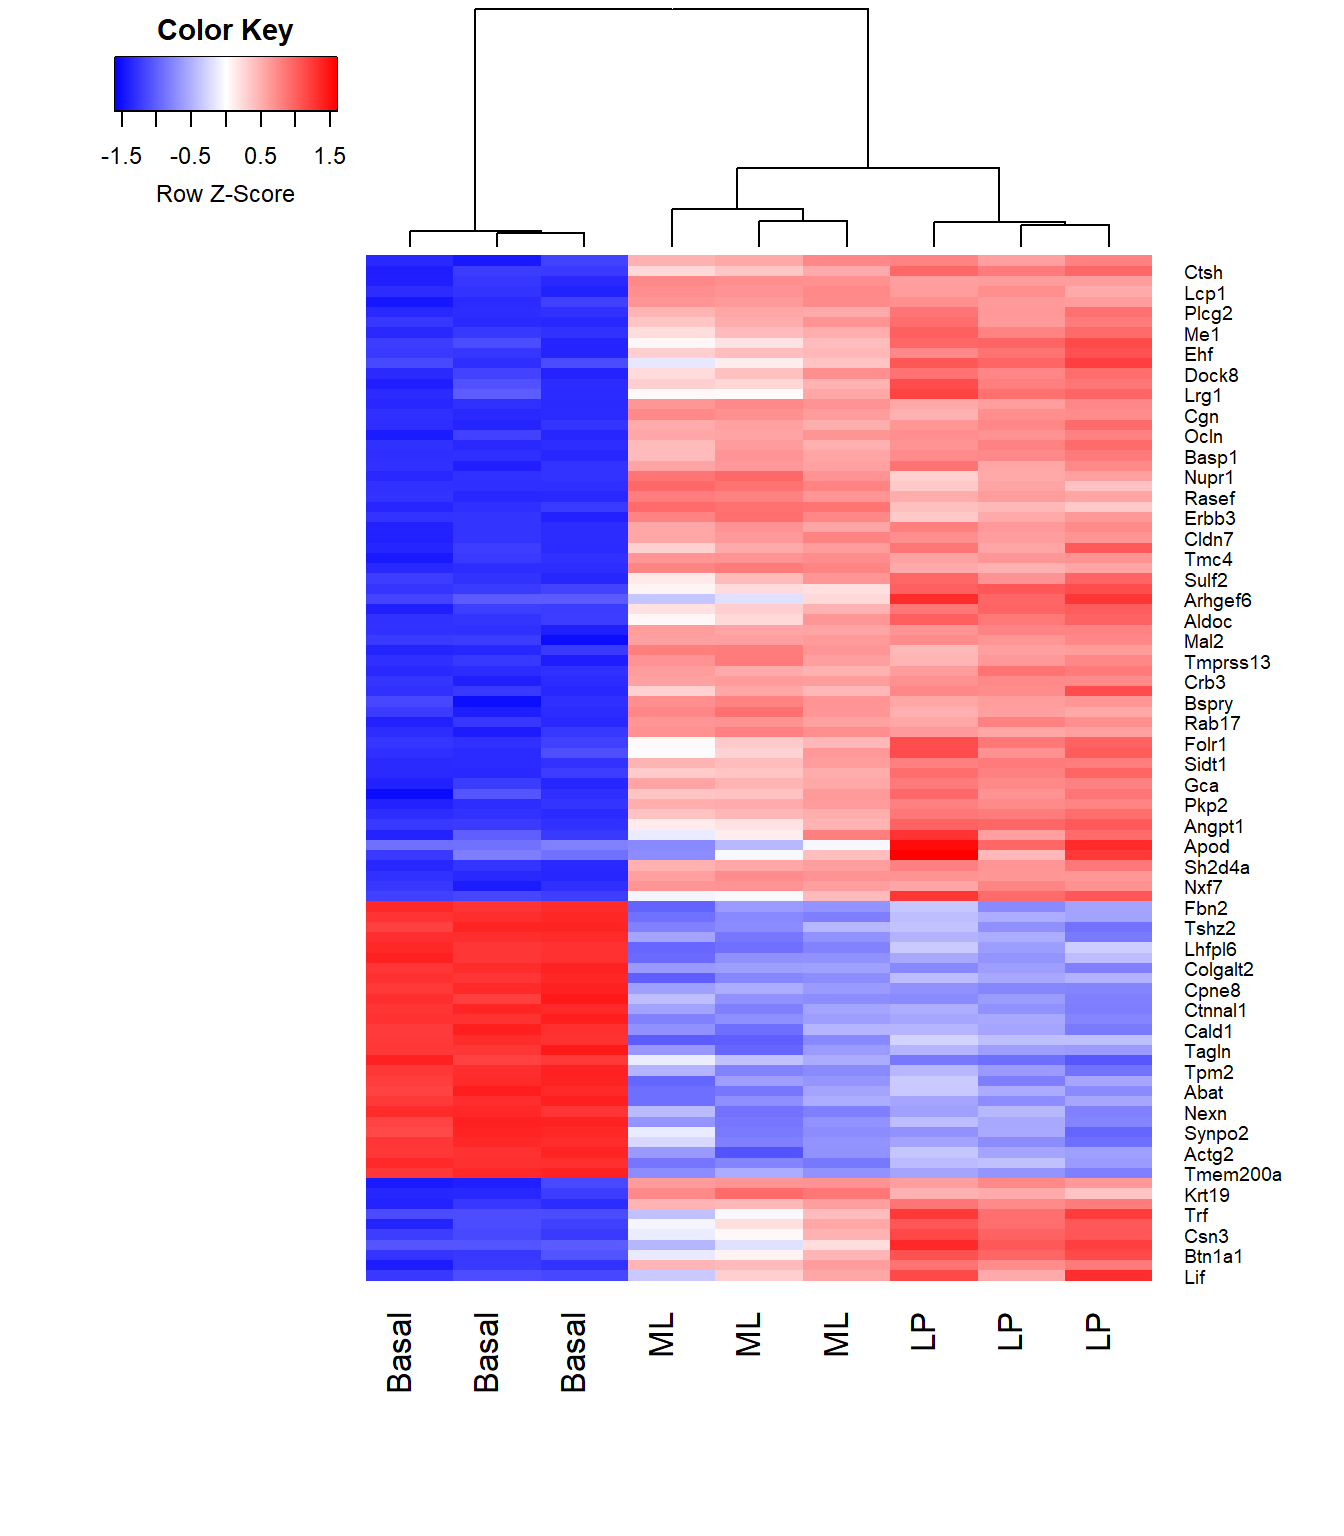
Data Visualization Tools
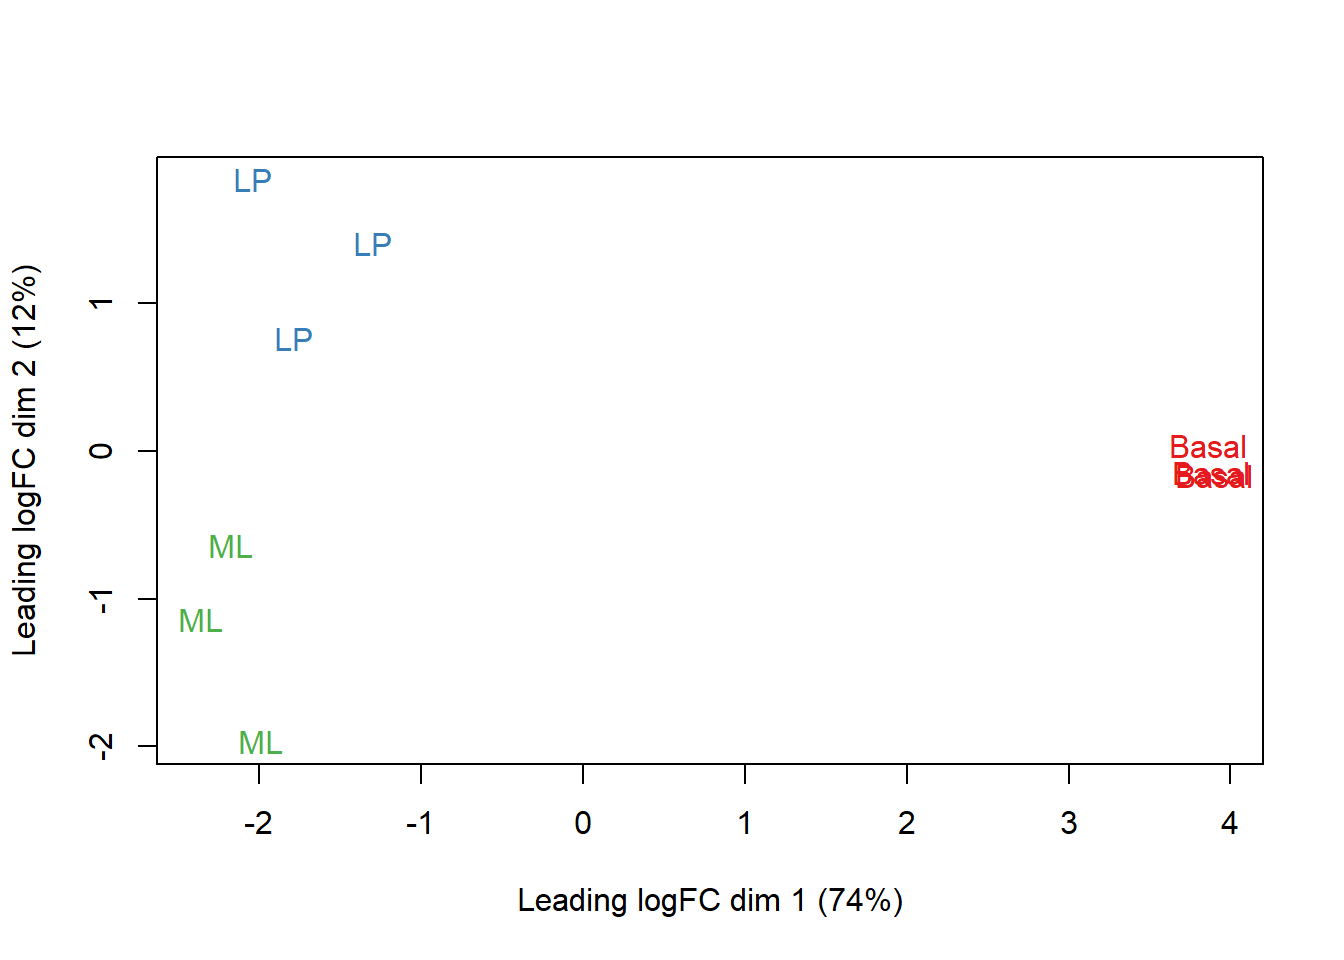
Data Visualization Tools

Challenges and Recommendations for Metabolomics Pathway Analysis
Wieder et al. (2021) demonstrated how changes in ORA parameters can drastically change analysis results.
Impact of input parameters on ORA results
- Background set selection
- Using a generic, non-assay-specific background set results in an increase in false-positive pathways (erroneously high levels of enriched pathways)
- DA metabolite selection
- Selecting a significance threshold (e.g. \(\text{q} \le 0.05\) or \(\text{p} \le 0.1\)) is an arbitrary choice
- Impacts the number of significant pathways detected
- Metabolite misidentification
- ORA is sensitive to even low levels of misidentification, including
- Pathway loss (false negatives)
- Pathway gain (false positives)
- Pathway database incompleteness
- Databases are constantly evolving
- Magnitude of changes between releases suggests ORA results may be “somewhat short-lived”
- Database ID harmonization
- Converting metabolite identifiers across databases often results in information loss
- Not all identifiers map well
Best practices in metabolomics ORA
- Background set
- Specify an assay-specific background set
- Typically includes all metabolites identified in the assay
- Organism specificity
- Use an organism-specific pathway set if the database supports it
- Consensus approach
- Perform ORA using multiple pathway databases (KEGG, Reactome, BioCyc)
- Derive a consensus pathway signature
- Statistical rigor
- Apply multiple-testing correction when selecting both DA metabolites and significant pathways
Functional Implications: Connecting Pathways to Gene and Protein Expression
- Systems biology views interactions between genes and their functions as a large network
- Moving beyond the “one gene, one protein, one function” principle (Chen et al. 2020)
- Abnormal regulation of protein function is a common factor in disease
Pathway analysis as a functional tool
Pathway analysis fundamentally helps understand the functional implications of molecular changes (metabolites, genes, proteins)
Multi-omics integration
Combining metabolomics data with other omics technologies (genomics, transcriptomics, proteomics)
- Chen et al. (2020) discusses multiomics for MS data
Integrating multi-omics data provides a more comprehensive understanding of biological systems
Can lead to improved predictions, a better understanding of disease mechanisms, and the identification of novel therapeutic targets
- Discordant trends
- Pointwise comparisons between proteomics and transcriptomics can reveal discordant trends
- Indication of significant transcriptional and post-translational regulation mechanisms
- Bioinformatics tools (often ML/AI-based) can be used to (Yousef and Allmer 2023; Chen et al. 2020)
- Reconstruct protein interaction and signaling networks from quantitative protein data
- Link protein changes directly to cellular processes like metabolism and biosignaling