11 scRNA-seq
Acknowledgments
These notes rely heavily on a publication by Hao et al. (2021) and some tutorials accompanying ShinyCell2 (Ouyang 2025). During the preparation of these notes Perplexity was used for identifying additional source material and Gemini was used to organize and summarize information.
Introduction to Single-Cell Genomics
Single-cell RNA-seq (scRNA-seq): principles and limitations
CITE-seq Technology: a multiomic approach
Data analysis concepts: integrating multiple modalities (WNN Analysis)
Reference mapping
scRNA-seq library prep
See Illumina (2025) and Vargas and Kethireddy (2023) for additional introductory material.
Cells are dissociated into a single-cell suspension
Cells are captured in individual droplets (Gel Beads in Emulsion or GEMs) using the 10x Genomics platform
Each GEM is labeled with a unique barcode
mRNA is converted to cDNA
cDNA is amplified
Sequencing libraries are prepared - different protocols exist for each sequencing target
- Transcriptome
- Antibody tags (ADTs) for cell-surface proteins
Power and limits of scRNA-seq
scRNA-seq profiles the transcriptome (RNA) of thousands of individual cells
- It is very good at characterizing cell types and cellular states in heterogeneous tissues
- It provides an unbiased view of cellular identity
However, RNA doesn’t tell the whole story
Cellular function is determined by RNA and proteins
RNA analysis alone cannot fully account for
- Post-transcriptional modifications
- Protein degradation
- Protein isoform detection
In some cell types (like T cells), scRNA-seq data quality can be technically challenging due to minimal RNA content and high RNase expression (Hao et al. 2021)
Many functionally distinct cell categories cannot be separated based on transcriptomics alone (Ding et al. 2020; Mereu et al. 2020)
Multiomics
Many important sources of cellular heterogeneity may not correlate strongly with transcriptomic features
Multimodal single-cell technologies simultaneously profile multiple data types (modalities) in the same cell
CITE-seq (Cellular Indexing of Transcriptomes and Epitopes by sequencing) is one example
CITE-seq Technology and Workflow
CITE-seq quantifies RNA and cell-surface proteins simultaneously
This combines the unbiased discovery power of scRNA-seq with specific antibody-based analysis
- scRNA-seq (transcriptome) measures the gene expression within the cell.
- Antibody-Derived Tags (ADTs) (epitopes) measure cell surface protein expression
CITE-seq workflow
Cell encapsulation: antibody-labeled cells are captured in Gel Beads in Emulsion (GEMs)
Barcoding: Inside the droplet, each cell is labeled with a unique barcode
- The cell barcode is added to the mRNA transcripts of the cell
- The same cell barcode is added to the labeled ADTs
- Library Preparation: Separate sequencing libraries are prepared for the
- mRNA (transcriptome)
- oligonucleotide tags (ADTs)
- Sequencing: A single sequencing run quantifies both RNA and ADTs
- Data Output: The output consists of two count matrices for the same set of cells:
- one for RNA
- one for ADT
Why is protein data important?
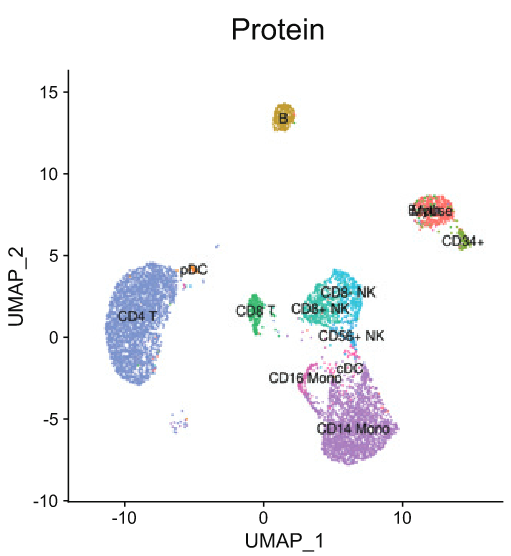
- In one study of Cord Blood Mononuclear Cells (CBMCs), independent analysis of RNA clustered CD4+ and CD8+ T cells together because their transcriptomes were highly similar (Hao et al. 2021)

- However, the protein data (ADTs for anti-CD4 and anti-CD8 antibodies) clearly separated these populations
Takehome message
- Protein (ADT) data is best for precisely identifying known phenotypes
- RNA data is best for unbiased, unsupervised discovery of novel or subtle states
High-Level Analysis Considerations
CITE-seq data is inherently challenging because the quality and information content of the two modalities vary widely
Protein measurements (ADTs)
- Often have higher copy numbers
- Are more robust (less “drop-out”) than RNA measurements
- If (when) the antibody panel is incomplete, the protein data might miss key cellular differences
A computational workflow must be able to define cell states using both modalities jointly
Weighted Nearest Neighbor (WNN) analysis
WNN Analysis is an analytical framework designed to integrate multiple data types measured within a single cell, leading to a joint definition of cellular state (Hao et al. 2021)
Unsupervised strategy - it does not require prior knowledge of cell types
Operates by constructing a single WNN graph, which accurately reflects the combination of both RNA and protein data
Modality weights
- WNN assigns cell-specific modality weights to each individual cell
- \(W_{RNA}\) and \(W_{Protein}\)
- Weights reflect the estimated information content of that modality for each specific cell
- They determine relative importance in downstream analysis
How are weights determined?
Neighbor Identification: The algorithm independently finds the nearest neighbors for a target cell based on RNA data alone, and separately based on protein data alone
Profile Prediction: The algorithm then uses those neighbors to predict the target cell’s molecular profile
- Predict the cell’s protein levels from its RNA neighbors
- Predict the cell’s RNA levels from its protein neighbors
Accuracy Assessment: Compare the accuracy of the predictions
- If the protein neighbors yield more accurate predictions than the RNA neighbors
- The cell is assigned a higher protein modality weight
Integration: Weights are used to calculate a weighted average of RNA and protein similarities to build the final WNN graph
WNN analysis
Researchers can perform standard single-cell analysis tasks (like visualization and clustering) on a single, unified dataset
WNN analysis improves the ability to resolve cell states compared to independent analyses.
Cells traditionally hard to separate by RNA (like different T cell subsets) often receive high protein weights, allowing the highly specific protein markers to dominate the cell clustering decision.
Rare progenitor cells, which often lack strong surface markers in a standard antibody panel, typically receive high RNA weights, allowing the transcriptome data to dominate and preserve their unique identity.
Advanced Analysis: Reference Mapping
- Large-scale CITE-seq experiments can generate comprehensive multimodal atlases
- We will be looking at one developed by Hao et al. (2021) in class
- Atlases provide well-annotated foundations for future studies
Reference mapping
Traditional analysis relies on unsupervised clustering (assuming minimal prior knowledge)
Reference mapping offers a supervised alternative
- A new single-cell experiment (the query) is interpreted using a pre-existing, well-defined atlas (the reference)
This is useful for
- Routine profiling
- Clinical contexts (like COVID-19 studies)
- Large-scale immune profiling
Step 1: Supervised PCA
Supervised PCA (sPCA) incorporates the weights from our WNN analysis to focus on RNA features that are more biologically relevant.
Identify which RNA features correspond to the protein-reinforced cell identities defined by the WNN graph
- PCA maximizes total variance (possibly capturing distracting noise)
- sPCA maximizes variance that captures the structure defined by the WNN graph (Barshan et al. 2011)
WNN analysis (RNA + Protein) “supervises” the PCA to find the optimal transcriptomic gene features that define the cell states
sPCA transformation is calculated once on the reference
Step 2: Projection & transfer
Projection: The sPCA transformation (learned from the reference) is mathematically applied (projected) onto the new query dataset
- This can be used on scRNA-seq data in the absence of protein data
Integration: This projection places the query cells into the same low-dimensional space as the reference
Annotation Transfer: Once integrated, the query cells can be labeled from the reference, typically based on the nearest neighbors from the reference.
Visualization: The query cells can be instantly visualized by projecting them onto the reference UMAP plot
Benefits of multimodal reference mapping
Automated Annotation: Provides high-resolution cell type annotations that would be difficult or impossible to find with unsupervised analysis of the query data alone
Protein Imputation: Reference mapping can impute the protein expression levels (ADTs) for the query cells, even if the query experiment did not measure protein
Increased Accuracy: Using a high-quality multimodal reference improves the accuracy of cell type identification
Discovery of Compositional Shifts: Enables the detection of subtle shifts in cell type abundance across disease conditions
Summary of CITE-seq and WNN Analysis
Summary table courtesy of Gemini
| Feature | scRNA-seq (RNA Only) | CITE-seq (RNA + ADT) | WNN Analysis |
| Data Types | Transcriptome (RNA) | Transcriptome + Surface Protein (ADT) | Integrates RNA and ADT data |
| Resolution | Limited resolution for similar cell types (e.g., T cells) | Improved resolution, linking genotype and phenotype | Maximal Resolution: Solves the integration challenge |
| Core Concept | Quantify gene expression in single cells | Use oligo-barcodes on antibodies to sequence protein levels | Calculates cell-specific modality weights (\(W_{RNA}\), \(W_{Protein}\)) |
| Benefit | Unbiased discovery of novel RNA states | Reduced technical noise, enhanced phenotype identification | Allows one modality to compensate for weaknesses in the other |