9 Bulk RNA-seq
Transcriptomics and RNA-Seq
What is Transcriptomics?
Transcriptomics is the study of the entire set of RNA transcripts (the transcriptome) present in a cell or organism at a specific time or under specific conditions.
Central Dogma
The central dogma of molecular biology states that genetic information flows from DNA to RNA to protein. mRNA acts as a template for protein synthesis.
Relevance
Measuring how much mRNA is transcribed can estimate how active a gene is under given circumstances.
This provides insight into the regulation status of all genes simultaneously.
- Gene Regulation Insights
- Understanding gene regulation under specific developmental stages or physiological conditions has greatly expanded knowledge
- Example: RNA-seq can identify differentially expressed (DE) genes in a Staphylococcus aureus strain when exposed to oxacillin, compared to a control, to better understand antibiotic resistance mechanisms.
Prokaryotic vs. Eukaryotic Genes
- Prokaryotic genes are
- Often organized in operons, groups of functionally-related genes that are collocated in a genome
- Transcribed in polycistronic units, a single mRNA that contains the coding sequences of multiple genes from a single operon
- Eukaryotic genes are
- Transcribed as single gene units
- Often contain non-translated introns and translated exons
Evolution of Gene Expression Analysis Technologies
Northern blotting
- RNA is extracted and treated with a denaturing agent
- RNA fragments are separated by size using gel electrophoresis
- RNA bands are transferred from the gel to a nylon membrane and fixed
- Radioactive or chemiluminescent probes are hybridized to the nylon membrane
- Membrane is washed and imaged to detect the location of target RNAs

Quantitative PCR (qPCR)
Northern blotting is good for identifying the presence of specific RNA sequences, but real-time quantitative PCR is faster and allows RNA quantification of several target RNAs at a time (Heid et al. 1996).
RNA is extracted
TaqMan probes matching the start and end of the target sequence(s) are added
RNA is converted to cDNA and amplified using PCR (polymerase chain reaction)
When TaqMan probes are encountered by the polymerase, the probe is broken up, releasing a fluorescent signal
Fluorescence is monitored during the reaction and used to infer the starting quantity of the target RNA

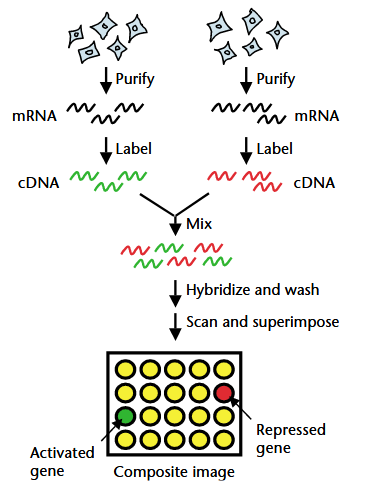
Microarrays
Microarrays enabled simultaneous quantification of thousands of RNA targets in paired samples (Stears, Martinsky, and Schena 2003).
- mRNA is extracted from two samples (e.g. case and control)
- RNA is converted to cDNA and labeled with fluorescent dyes (one red, one green)
- Labeled cDNA is hybridized to a chip with complementary DNA probes a specific locations on the chip
- Unhybridized sample is washed away and the chip is imaged
- Red spots: gene expression is increased in sample 1
- Green spots: gene expression is increased in sample 2
- Yellow spots: gene expression is similar between samples 1 and 2
- Dark spots: gene expression is low in both samples
Limitations of Traditional Methods
- Rely on specific hybridization probes and primers
- You only find what you’re looking for

RNA Sequencing (RNA-seq)
As the cost of NextGen sequencing decreased, RNA-seq replaced hybridization techniques in genome-wide expression studies (i.e. transcriptomics).
What is RNA-Seq?
RNA-seq uses high-throughput sequencing to detect genome-wide transcription.
- Allows for a genome-wide quantification of RNA
- Provides a much broader and unbiased view than previous methods
Applications
- Differential Gene Expression (DGE)
- Differential alternative splicing
- Transcript discovery (e.g. long non-coding RNAs, microRNAs)
- Genome annotation (de novo transcriptome assembly)
- Allele-specific expression
- RNA editing, fusion discovery, variant detection
RNA-Seq Experimental Design
RNA-Seq Workflow
- Extract RNA
- Converting it to cDNA
- Sequencing the cDNA
- Match the sequence data to genes
Focus on mRNA
While total RNA or small RNA can be sequenced, we’ll focus on mRNA from a single culture today.
- mRNA typically constitutes about 2% of total cellular RNA
- Assumption: changes in mRNA levels correlate with the phenotype (protein expression)
Experimental Design Considerations
- Biological Replicates:
- More biological replicates (
at least two, at least three) is required to increase statistical power - Needed to distinguish observed differences from external factors and random variation
- More biological replicates (
- Sequencing Platform:
- Illumina short-read technology is common
- Long-read technologies are helpful for detecting alternative splicing and different isoforms
- 10x genomics is a microfluidics platform - paired with RNA-seq enables single cell sequencing
- Sequencing Strategy:
- Paired-end sequencing improves mapping accuracy, especially for differential expression of low-expressed genes
- Single-end sequencing is less expensive
- Read length:
- Typical read length is 50–250 bp
- Sequencing coverage/depth:
- Read depth must be considered for each experiment
- Higher depth ensures better detection of lowly expressed genes
- More replicates can sometimes be preferred over increased depth
- Example: 16S rRNA amplicon sequencing typically targets 50,000 reads per sample
Preparing an RNA-seq Library
We’ll review the Illumina Tru-seq protocol for this example (Illumina 2012).
- Start with 0.1–4 μg of total RNA, aiming for an RNA Integrity Number (RIN) value ≥ 8.
- Depletion or removal of rRNA
- Ribosomal RNA (rRNA) makes up the majority of total RNA and must be removed or mRNA must be captured
- Poly-A selection: Captures mRNA with 3’ polyadenylated poly(A) tails, common in mature eukaryotic mRNA.
- Ribo-depletion: For whole RNA sequencing or prokaryotic RNA (which lacks poly-A tails), rRNA depletion kits (e.g., RiboZero) are used.
- Ribosomal RNA (rRNA) makes up the majority of total RNA and must be removed or mRNA must be captured
- RNA is fragmented
Conversion of RNA into complementary DNA (cDNA)
Addition of sequencing adapters to allow attachment to the flow cell for sequencing
- Barcodes/indexes are used to multiplex multiple samples in one sequencing run
PCR amplification
Quality control
RNA-Seq Data Analysis Workflow
Today we will use
FastQCfor QCtrimmomaticfor trimmingSTARAligner for mapping readssamtoolsfor processing mapped readssubreadfor read counting and summarization
QC
- Use FastQC to check our data
- Use Cutadapt to trim/filter any bad reads or bases
- Run FastQC again
Mapping and processing
- Align reads using STAR
- Convert output to bam (if it isn’t already)
- Sort and index the bam file for downstream processing
- Count the reads in our bam file
Expression Quantification and Differential Gene Expression
subread(and other programs) will give us a count matrix for quantification of gene expression.- The output should be a matrix of integer counts for each gene (column) and individual (row)
Normalization
- Normalization is required to account for
Sequencing depth bias: If one library has 20M reads and another 40M, the latter will generally show approximately double the counts for most genes.
Compositional bias: Highly expressed genes might be over represented at the expense of lowly expressed genes.
Common Normalization Methods
- Reads Per Kilobase per Million (RPKM):
- Used for single-end RNA-seq. Calculated by dividing a gene’s read count by its length and the total number of reads.
- Fragments Per Kilobase Million (FPKM):
- Used for paired-end RNA-seq.
Differential Gene Expression Analysis
The aim for differential gene expression analysis is to quantify difference in gene expression between two or more treatments or groups.
Statistical Analysis
- Bioconductor has several good options for statistical analysis, including:
- DESeq2
- EdgeR
Multiple Hypothesis Testing
- When analyzing genomic data, we must account for the number of statistical tests we are performing.
- The Benjamini–Hochberg and Bonferroni methods are common solutions to effectively reduce false positives.
Visualization
- Dimensionality reduction is helpful to identify clusters in the data to give some clues about global patterns in the data
- Principal Component Analysis (PCA) is a common technique but it assumes relationships are linear and tends to have issues with massive datasets like those coming from scRNA-Seq
- tSNE and UMAP allow for non-linear relationships and are typically used in scRNA-Seq
Functional Annotation and Enrichment Analysis
Gene Ontology (GO) terms: Relating genes to biological processes using GO terms (molecular function, biological processes, and cellular components).
Enrichment analysis: Identify over represented gene sets that share common functions or pathways
Pathway analysis: Identify gene pathways involved in response to disease or drug treatment
Challenges in Annotation
- Converting protein names to gene names
- Many-to-many relationships
- Often labor-intensive and can lead to information loss
- Outdated databases
Inadequate database curation / lack of common data formats for cross-database referencing
Automatic annotation procedures can decrease confidence and reliability
- Manual annotation is often necessary for accurate gene models
Data Visualization Beyond PCA
- Heatmaps and Boxplots:
- Present taxonomic comparisons and diversity in microbial communities.
- Cytoscape:
- Integrating biological networks and gene expression data
- Visualizing enriched pathways
- Network Reconstruction:
- Proteomics data can be used to reconstruct protein interactions and signaling networks.
- Most network inference tools are available through R and Python libraries or integrated web services.